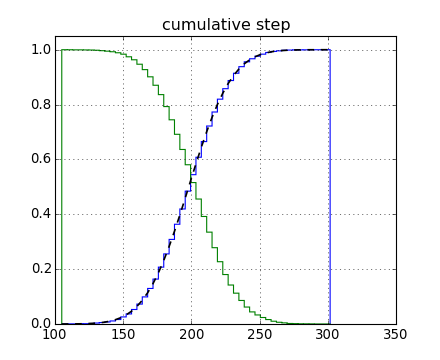

(Source code, png)

"""
Demo of the histogram (hist) function used to plot a cumulative distribution.

"""
import numpy as np
import matplotlib.pyplot as plt
from matplotlib import mlab


mu = 200
sigma = 25
n_bins = 50
x = mu + sigma*np.random.randn(10000)

n, bins, patches = plt.hist(x, n_bins, normed=1,
                            histtype='step', cumulative=True)

# Add a line showing the expected distribution.
y = mlab.normpdf(bins, mu, sigma).cumsum()
y /= y[-1]
plt.plot(bins, y, 'k--', linewidth=1.5)

# Overlay a reversed cumulative histogram.
plt.hist(x, bins=bins, normed=1, histtype='step', cumulative=-1)

plt.grid(True)
plt.ylim(0, 1.05)
plt.title('cumulative step')

plt.show()
Keywords: python, matplotlib, pylab, example, codex (see Search examples)