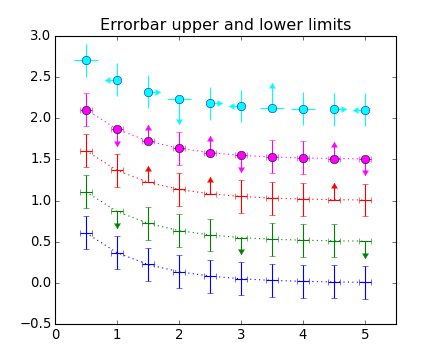

(Source code, png)

"""
Demo of the errorbar function, including upper and lower limits
"""
import numpy as np
import matplotlib.pyplot as plt

# example data
x = np.arange(0.5, 5.5, 0.5)
y = np.exp(-x)
xerr = 0.1
yerr = 0.2
ls = 'dotted'

fig = plt.figure()
ax = fig.add_subplot(1, 1, 1)

# standard error bars
plt.errorbar(x, y, xerr=xerr, yerr=yerr, ls=ls, color='blue')

# including upper limits
uplims = np.zeros(x.shape)
uplims[[1, 5, 9]] = True
plt.errorbar(x, y + 0.5, xerr=xerr, yerr=yerr, uplims=uplims, ls=ls,
             color='green')

# including lower limits
lolims = np.zeros(x.shape)
lolims[[2, 4, 8]] = True
plt.errorbar(x, y + 1.0, xerr=xerr, yerr=yerr, lolims=lolims, ls=ls,
             color='red')

# including upper and lower limits
plt.errorbar(x, y + 1.5, marker='o', ms=8, xerr=xerr, yerr=yerr,
             lolims=lolims, uplims=uplims, ls=ls, color='magenta')

# including xlower and xupper limits
xerr = 0.2
yerr = np.zeros(x.shape) + 0.2
yerr[[3, 6]] = 0.3
xlolims = lolims
xuplims = uplims
lolims = np.zeros(x.shape)
uplims = np.zeros(x.shape)
lolims[[6]] = True
uplims[[3]] = True
plt.errorbar(x, y + 2.1, marker='o', ms=8, xerr=xerr, yerr=yerr,
             xlolims=xlolims, xuplims=xuplims, uplims=uplims, lolims=lolims,
             ls='none', mec='blue', capsize=0, color='cyan')

ax.set_xlim((0, 5.5))
ax.set_title('Errorbar upper and lower limits')
plt.show()
Keywords: python, matplotlib, pylab, example, codex (see Search examples)