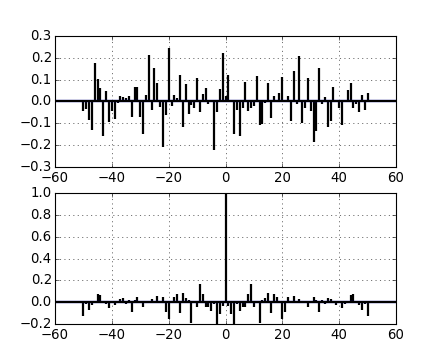

(Source code, png)

import matplotlib.pyplot as plt
import numpy as np

x, y = np.random.randn(2, 100)
fig = plt.figure()
ax1 = fig.add_subplot(211)
ax1.xcorr(x, y, usevlines=True, maxlags=50, normed=True, lw=2)
ax1.grid(True)
ax1.axhline(0, color='black', lw=2)

ax2 = fig.add_subplot(212, sharex=ax1)
ax2.acorr(x, usevlines=True, normed=True, maxlags=50, lw=2)
ax2.grid(True)
ax2.axhline(0, color='black', lw=2)

plt.show()
Keywords: python, matplotlib, pylab, example, codex (see Search examples)