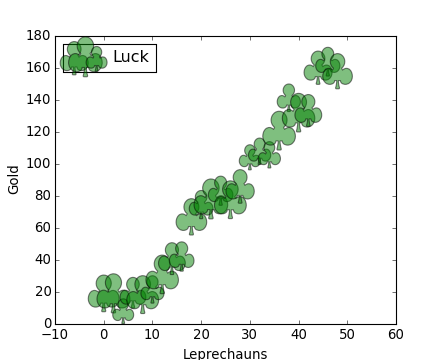

(Source code, png)

from matplotlib import pyplot as plt
import numpy as np
import matplotlib

x = np.arange(0.0, 50.0, 2.0)
y = x ** 1.3 + np.random.rand(*x.shape) * 30.0
s = np.random.rand(*x.shape) * 800 + 500

plt.scatter(x, y, s, c="g", alpha=0.5, marker=r'$\clubsuit$',
            label="Luck")
plt.xlabel("Leprechauns")
plt.ylabel("Gold")
plt.legend(loc=2)
plt.show()
Keywords: python, matplotlib, pylab, example, codex (see Search examples)