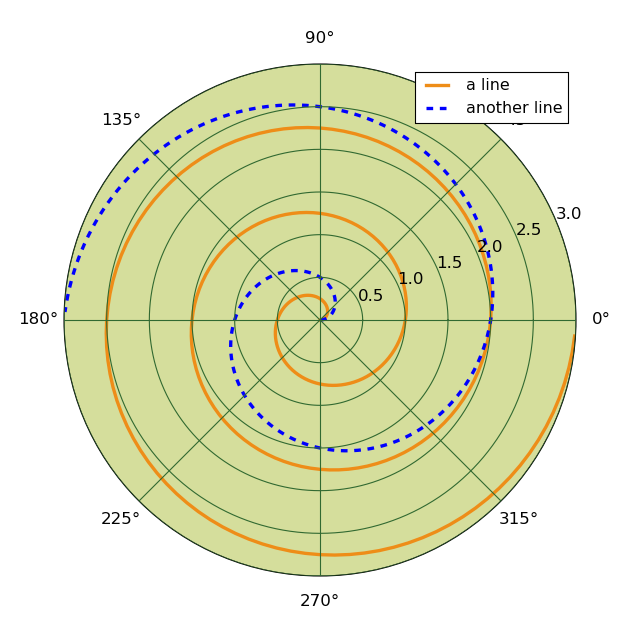

(Source code, png)

#!/usr/bin/env python

import numpy as np
from matplotlib.pyplot import figure, show, rc

# radar green, solid grid lines
rc('grid', color='#316931', linewidth=1, linestyle='-')
rc('xtick', labelsize=15)
rc('ytick', labelsize=15)

# force square figure and square axes looks better for polar, IMO
fig = figure(figsize=(8, 8))
ax = fig.add_axes([0.1, 0.1, 0.8, 0.8], polar=True, axisbg='#d5de9c')

r = np.arange(0, 3.0, 0.01)
theta = 2*np.pi*r
ax.plot(theta, r, color='#ee8d18', lw=3, label='a line')
ax.plot(0.5*theta, r, color='blue', ls='--', lw=3, label='another line')
ax.legend()

show()
Keywords: python, matplotlib, pylab, example, codex (see Search examples)